Ok, I’m no physicist, so I really don’t mean to get into the weeds of this classical mechanics problem, but I am a lover of Sci-Fi, and Liu Cixin’s Three-Body Problem presents an absolute masterpiece in hard sci-fi story telling. If you like Arthur C. Clarke, and you want to read a new voice in creative science fiction rooted in current theory, then please look into this first book in the Remembrance of Earth’s Past trilogy.
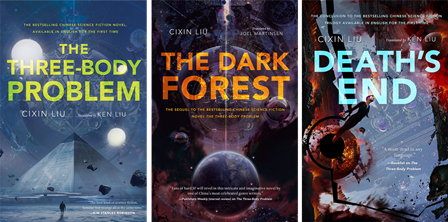
That said, in physics, the three-body problem refers to the challenge of calculating the motions of three celestial bodies that are gravitationally interacting with a chaotic and unpredictable behavior. Sorry if I butchered that, but again, my understanding is that to begin to solve this complex problem, physicists have to first define the system.
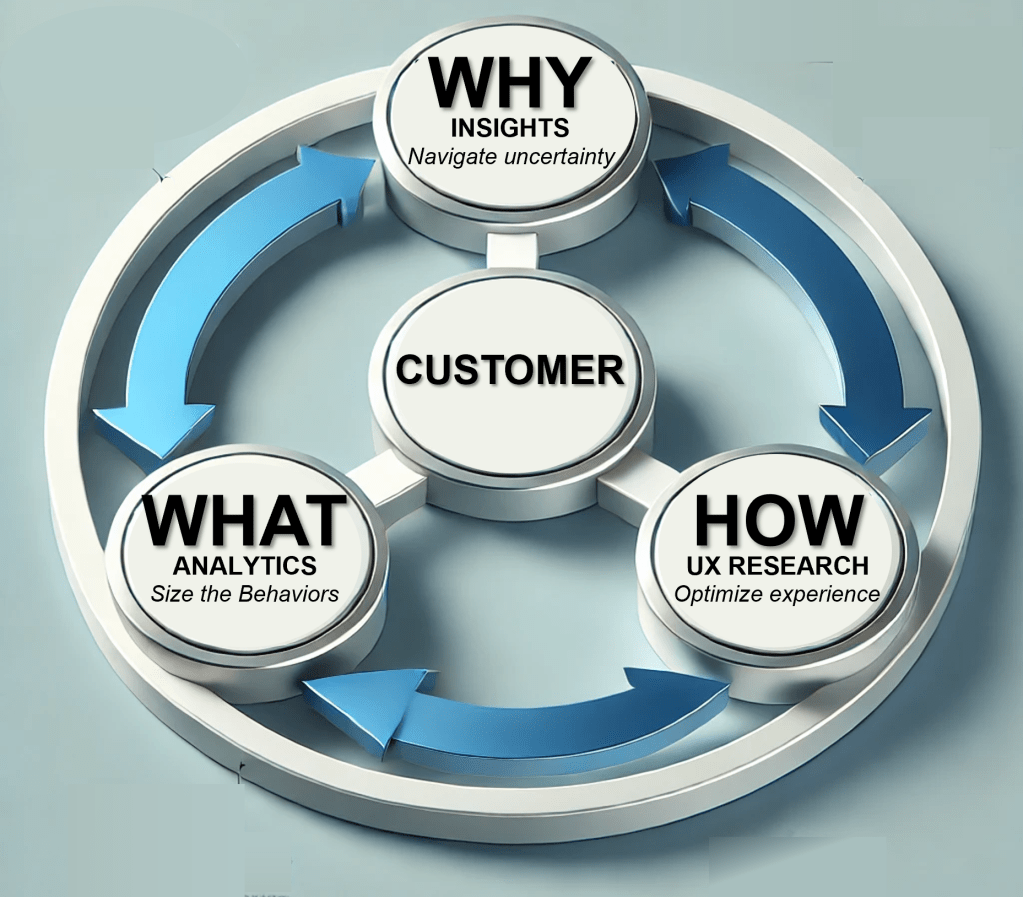
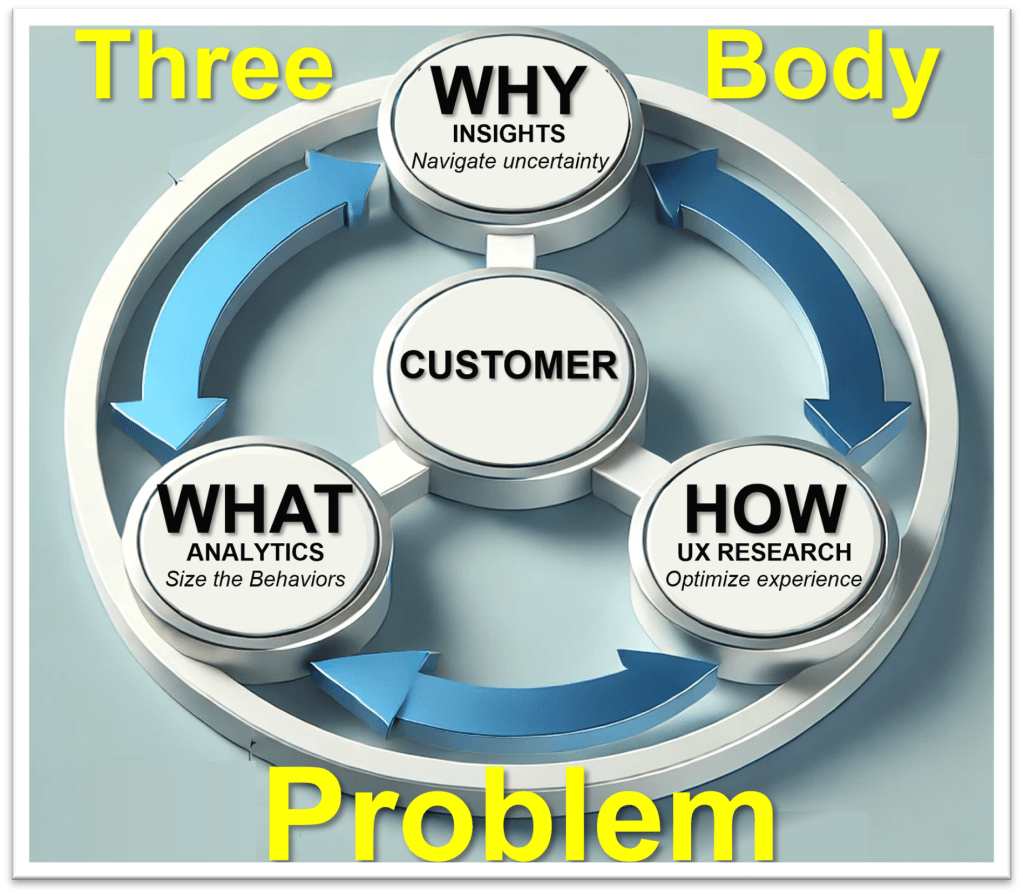
In consumer research, these three celestial bodies are Analytics, Insights, and User Experience (UXR). The three gravitationally interact with each other as well as with the corporate goal of understanding the customer. To understand how to best use each discipline, we must first understand the nature of each discipline.
Consumer Insights = WHY
Consumer Insights looks to understand WHY people do what they do. Or, perhaps more importantly, WHY people do NOT do what you want them to do. Typically characterized as “self-reported” research, this work involves assessing the perceptions, motivations, desires, and blockers as described by the customer.
The main modalities for collecting this type of information include:
- Surveys
- Focus Groups
- Individual Interviews
While several sub methods exist for each, focus on the common thread that these modalities all revolve around asking questions of the respondent.
A myriad of biases can influence this type of question and answer feedback, and those biases tend to be the cornerstone of any argument from Analytics regarding the validity of self-reported data. More succinctly, those who believe that Analytics is Stronger Kung Fu like to argue that what people say does not often align with what they do. This is true, and the often referred to “say-do gap”, and related “value-action gap”, is well researched. Please explore those theories in more detail, but for now, know this – as stated by Brian O’Blivion in the 1983 David Cronenberg cult classic “Videodrome” – “there is nothing real outside our perception of reality”
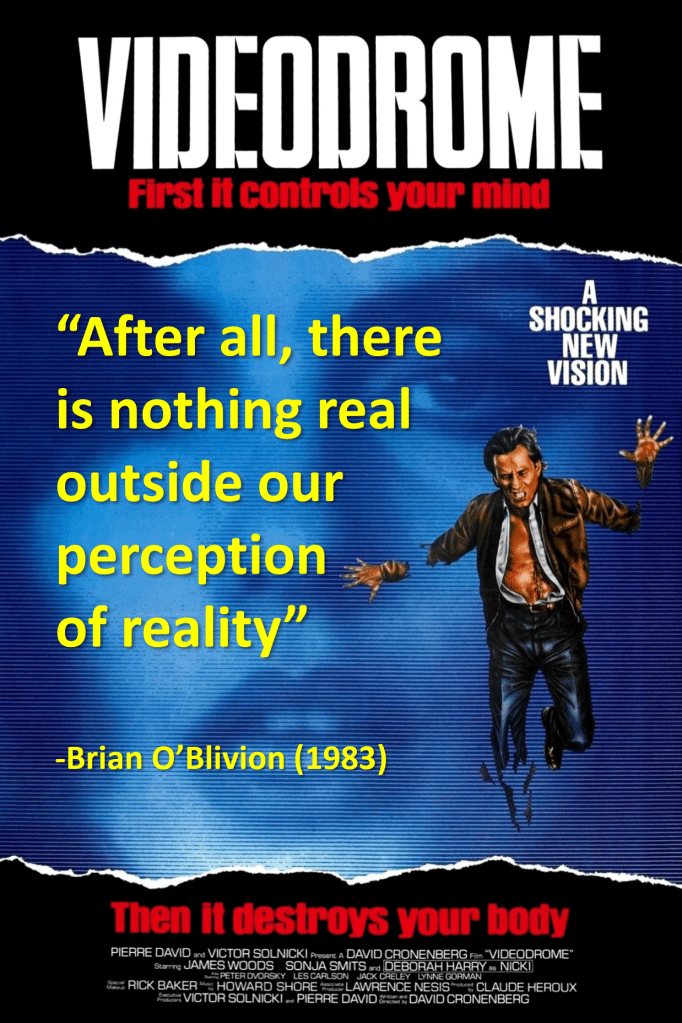
That is to say that we must understand what potential customers think and feel about a category or product, because that ultimately is their reality.
CONSUMER ANALYTICS = WHAT
Data derived from data streams that record actual events and choices performed by an individual make up the sandbox for Consumer Analytics. These data streams can come from:
- DTC Sales
- Web traffic
- CRM
- Hardware logs
- App telemetry
This information can provide an amazing wealth of insights, especially if the data streams are connected by some sort of unique user Id to allow for a robust picture of an individual’s behavior across a multitude of touchpoints. For this reason, I have limited the above list to those data streams where the ability exists to identify known users. Of course, the data can still be analytically valuable even if a customer key does not exist, but in that scenario, these data streams are more siloed, and only correlations can be drawn where consistent cohorts can be identified.
For many, this behavior data, that captures exactly what someone does regardless of what they say they want or will do, provides the greatest source of truth, and therefore the strongest Kung Fu. However, significant biases may exist in this data due to experiential issues such as:
- Feature Availability: Did the behavior exist because it solved problem, or:
- Did the behavior exist because there was no better alternative
- Did the behavior not exist because because the feature was not present
- Communication / Information Architecture: Was the absence of a behavior due to choice, or:
- Was the absence of a behavior due to a lack of understanding
- Was the absence of a behavior due to an inability to find the feature
- Ease of Effort: Did the behavior exist because it was the easiest method, or:
- Did the behavior not exist because it was too difficult
- Did the behavior not exist because it was not intuitive
In short, how do we distinguish satisfactory choices and behaviors that solve a problem from unsatisfactory choices and behaviors from the absence of choice. More simply, as the Witcher’s Geralt of Rivia states “If I have to choose between one evil and another, then I prefer not to choose at all.”

Hence, we can not immediately conclude that the absence of a choice reflects a lack of desire for the behavior, nor can we conclude that a choice conveys satisfaction with the behavior. Which leads to UX Research, where a researcher can better understand How people do what they do, or do not do.
USER EXPERIENCE RESEARCH = HOW
UXR studies HOW people do what they do by observing the interaction with hardware and software. From physical ergonomics of the “the buttons are too hard to push” or the “the battery keeps falling out”, to human/computer interaction through firmware or software menus, communications, and inputs, to information conveyance via nomenclature, iconography, and “How To’s”, UXR looks to reduce friction by making any experience easier, more intuitive, and more understandable. Paths to assess these experiences include:
- Think Aloud interviews, where a users describes what they are thinking while performing a task.
- Observation, where the researcher simply observes the behavior, either live or after the fact via a recording
These studies can also take place:
- In lab, where the product, information, tasks, or stimuli can be controlled
- In field, where the organic use of a product can be fully appreciated
While this form of consumer research Kung Fu prides itself on the low sample size required for detailed feedback, the UXR challenge lies in scaling up to represent a multitude of consumer cohorts. As well, while a valuable tool for learning how someone behaves the way they do, this modality may not directly lead to an understanding of what someone would rather want to do, which may lead to suboptimal solutions, which brings us back to the need to layer in the Consumer Insights discussion of WHY.
Over the years, I have seen a variety of diagrams that try to depict the relationship between all of these modes of research. However, they typically approach this from a linear perspective, which only reinforces the idea that this is a hierarchy to the modalities. Here is a post from just the other day that presents this chart with a classic misinterpretation.
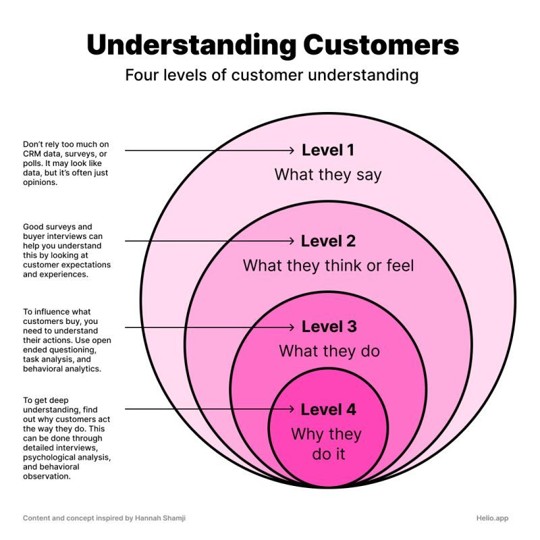
While the left-side text of the chart speaks to the style of questions needed to get to a deeper understanding of the consumer, the chart itself reads more like a depth chart of modalities. In fact, the researcher who posted this then directly, and erroneously, linked the first three outer circles to Survey, Social Media Sentiment, and Analytics. At least he allowed the inner circle to represent a combination of Survey and Analytics.
However, this erroneous interpretation of the chart also presents a complete over simplification of the interplay of these disciplines. Insights, Analytics, and UXR are not linear and do not have a hierarchical prioritization. Instead, they are constantly gravitating around each other much like the traditional bodies in the three-body problem. However, the model of this movement fluctuates as the pattern depends on the current state of question regarding understanding the consumer.
A finding generated with one method will frequently lead to a new question more appropriate for another research modality. This process constantly iterates and repeats. That is good science, and these methods, as Dwayne Schneider from One Day at a Time would say are simply “the right tool for the right job”.


Leave a comment